Economic Value-Added (EVA®) statement
Economic Value-Added is the surplus generated by an entity after meeting an equitable charge towards providers of capital. It is the post-tax return on capital employed (adjusted for the tax shield on debt) less the cost of capital employed. Companies which earn higher returns than cost of capital create value, and companies which earn lower returns than cost of capital are deemed harmful for shareholder value.
in Rs. crore, except as otherwise stated
| 2010 | 2009 | 2008 | 2007 | 2006 | |
| Cost of capital | |||||
| Return on risk free investment (%) | 7.20 | 7.00 | 8.00 | 8.00 | 7.50 |
| Market premium (%) | 5.00 | 7.00 | 7.00 | 7.00 | 7.00 |
| Beta variant | 0.68 | 0.74 | 0.76 | 0.99 | 0.78 |
| Cost of equity (%) | 10.60 | 12.18 | 13.32 | 14.97 | 12.96 |
| Average debt / total capital (%) | – | – | – | – | – |
| Cost of debt – net of tax (%) | NA | NA | NA | NA | NA |
| Weighted Average Cost of Capital (WACC) (%) | 10.60 | 12.18 | 13.32 | 14.97 | 12.96 |
| Average capital employed | 20,786 | 16,025 | 12,527 | 9,147 | 6,177 |
| Economic Value-Added (EVA®) | |||||
| Operating profits | 6,956 | 6,434 | 4,640 | 3,877 | 2,654 |
| Less: Tax | 1,681 | 919 | 685 | 386 | 313 |
| Cost of capital | 2,203 | 1,952 | 1,669 | 1,369 | 801 |
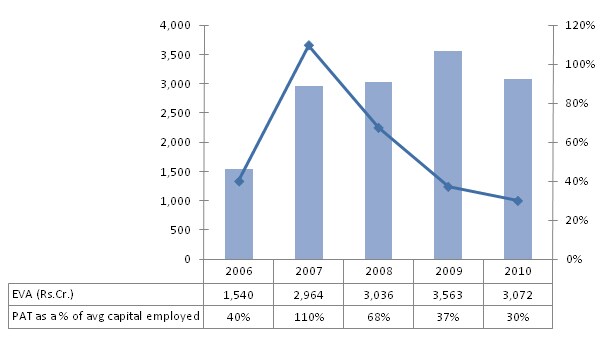
| Economic Value-Added | 3,072 | 3,563 | 2,286 | 2,122 | 1,540 |
| Enterprise value | |||||
| Market value of equity | 1,50,110 | 75,837 | 82,362 | 1,15,307 | 82,154 |
| Add: Debt | – | – | – | – | – |
| Less : Cash and cash equivalents | 15,819 | 10,993 | 8,307 | 6,033 | 4,709 |
| Enterprise value | 1,34,291 | 64,844 | 74,055 | 1,09,274 | 77,445 |
| Return ratios | |||||
| PAT / average capital employed (%) | 30.1 | 37.4 | 37.2 | 42.2 | 40.1 |
| EVA® / average capital employed (%) | 14.8 | 22.2 | 18.2 | 23.2 | 24.9 |
| Enterprise value / average capital employed (x) | 6.5 | 4.0 | 5.9 | 11.9 | 12.5 |
| Growth (%) | |||||
| Operating profits | 8.1 | 38.7 | 19.7 | 46.1 | 29.6 |
| Average capital employed | 29.7 | 27.9 | 37.0 | 48.1 | 42.6 |
| EVA® | (13.8) | 55.9 | 7.7 | 37.8 | 36.0 |
| Market value of equity | 97.9 | (7.9) | (28.6) | 40.4 | 34.5 |
| Enterprise value | 107.1 | (12.4) | (32.2) | 41.1 | 33.4 |
| Note: | Cost of equity = return on risk-free investment + expected risk premium on equity investment adjusted for our beta variant in India. Figures above are based on consolidated Indian GAAP financial statements. Cash and cash equivalents includes investments in liquid mutual funds and certificate of deposits. |