Shareholder information
Shareholding pattern
| Category | March 31, 2010 |
March 31, 2009 |
||||
| Shareholders (no.) | Voting strength (%) | Number of shares held | Shareholders (no.) | Voting strength (%) | Number of shares held | |
| Founders holding | ||||||
| Indian founders | 19 | 16.05 | 9,20,84,978 | 19 | 16.49 | 9,44,84,978 |
| Total founders holding (A) | 19 | 16.05 | 9,20,84,978 | 19 | 16.49 | 9,44,84,978 |
| Public shareholding | ||||||
| Institutional investors | ||||||
| Mutual funds | 266 | 4.02 | 2,30,90,168 | 254 | 3.58 | 2,05,19,719 |
| Banks, financial institutions and insurance companies | 55 | 3.90 | 2,24,10,708 | 63 | 4.16 | 2,38,01,421 |
| Foreign institutional investors | 892 | 36.36 | 20,86,37,229 | 817 | 34.85 | 19,96,64,124 |
| Others | ||||||
| Private corporate bodies | 3,223 | 5.40 | 3,09,81,305 | 3,520 | 3.51 | 2,00,85,568 |
| Indian public | 3,70,644 | 14.33 | 8,22,20,794 | 4,84,412 | 16.89 | 9,67,35,467 |
| NRIs / OCBs / Foreign nationals | 6,571 | 0.81 | 46,58,086 | 7,776 | 0.89 | 51,05,579 |
| Trusts | 45 | 0.50 | 28,65,977 | 45 | 0.50 | 28,45,557 |
| Total public shareholding (B) | 3,81,696 | 65.32 | 37,48,64,267 | 4,96,887 | 64.38 | 36,87,57,435 |
| Equity shares underlying ADS (C) | 1 | 18.63 | 10,68,75,947 | 1 | 19.13 | 10,95,87,630 |
| Total (A + B + C) | 3,81,716 | 100.00 | 57,38,25,192 | 4,96,907 | 100.00 | 57,28,30,043 |
Stock market data – Exchanges in India
BSE |
NSE |
Total Volume | |||||
| High (Rs.) | Low (Rs.) | Volume (No.) | High (Rs.) | Low (Rs.) | Volume (No.) | (BSE & NSE) (No.) | |
| 2009 | |||||||
| April | 1,507.30 | 1,341.30 | 42,60,975 | 1,509.25 | 1,345.20 | 3,53,52,910 | 3,96,13,885 |
| May | 1,769.85 | 1,507.95 | 43,27,592 | 1,800.10 | 1,502.40 | 3,73,51,038 | 4,16,78,630 |
| June | 1,826.75 | 1,627.00 | 37,10,348 | 1,827.10 | 1,629.90 | 3,54,52,386 | 3,91,62,734 |
| July | 2,063.90 | 1,676.75 | 57,61,512 | 2,064.35 | 1,677.55 | 3,89,63,214 | 4,47,24,726 |
| August | 2,189.75 | 1,950.70 | 29,48,591 | 2,191.80 | 1,951.50 | 2,49,93,760 | 2,79,42,351 |
| September | 2,405.60 | 2,142.65 | 27,21,144 | 2,410.15 | 2,144.90 | 2,84,28,490 | 3,11,49,634 |
| October | 2,325.75 | 2,165.45 | 35,39,414 | 2,336.75 | 2,177.60 | 3,06,62,825 | 3,42,02,239 |
| November | 2,433.60 | 2,139.35 | 46,84,006 | 2,438.55 | 2,143.05 | 1,88,65,100 | 2,35,49,106 |
| December | 2,605.25 | 2,376.70 | 28,05,888 | 2,601.10 | 2,376.95 | 2,02,15,633 | 2,30,21,521 |
| 2010 | |||||||
| January | 2,689.10 | 2,464.45 | 34,49,619 | 2,689.75 | 2,464.20 | 2,36,90,547 | 2,71,40,166 |
| February | 2,612.45 | 2,352.20 | 19,56,077 | 2,617.35 | 2,352.70 | 1,84,38,825 | 2,03,94,902 |
| March | 2,805.60 | 2,615.10 | 21,73,459 | 2,813.95 | 2,615.95 | 2,16,05,944 | 2,37,79,403 |
| Total | 2,805.60 (1) | 1,341.30 (1) | 4,23,38,625 | 2,813.95 (1) | 1,345.20 (1) | 33,40,20,672 | 37,63,59,297 |
| Volume traded / average outstanding shares (%) | FY 2010 | 9 | 72 | 81 | |||
| FY 2009 | 18 | 100 | 118 | ||||
| FY 2008 | 16 | 84 | 100 | ||||
Note : The number of shares outstanding is 46,69,49,245. American Depositary Shares (ADSs) have been excluded for the purpose of this calculation.
(1) Represents yearly high and yearly low of equity shares.
(1) Represents yearly high and yearly low of equity shares.
Stock market data – NASDAQ
| High ($) | Low ($) | High (Rs.) | Low (Rs.) | Volume | |
| 2009 | |||||
| April | 30.81 | 26.81 | 1,541.42 | 1,341.30 | 6,65,80,216 |
| May | 34.90 | 30.36 | 1,644.48 | 1,430.56 | 5,62,23,722 |
| June | 37.66 | 34.84 | 1,804.29 | 1,669.18 | 5,13,57,917 |
| July | 43.03 | 34.29 | 2,062.86 | 1,643.86 | 6,68,71,231 |
| August | 44.95 | 40.59 | 2,194.91 | 1,982.01 | 4,24,04,044 |
| September | 49.29 | 43.13 | 2,371.34 | 2,074.98 | 3,98,54,907 |
| October | 49.59 | 46.00 | 2,329.24 | 2,160.62 | 5,07,97,917 |
| November | 52.64 | 46.38 | 2,448.81 | 2,157.59 | 3,07,87,947 |
| December | 55.99 | 51.65 | 2,605.21 | 2,403.27 | 2,97,48,220 |
| 2010 | |||||
| January | 58.75 | 51.91 | 2,712.49 | 2,396.68 | 3,52,31,015 |
| February | 56.90 | 50.69 | 2,622.52 | 2,336.30 | 3,16,62,659 |
| March | 62.32 | 58.19 | 2,798.17 | 2,612.73 | 3,31,19,326 |
| Total | 62.32(1) | 26.81(1) | 2,798.17(1) | 1,341.30(1) | 53,46,39,121 |
Note : 1 ADS = 1 equity share. U.S. Dollar has been converted into Indian Rupees at the monthly closing rates. The number of ADSs outstanding as at March 31, 2010 was 10,68,75,947. The percentage of volume traded to the total float was 500.24% as against 747.57% in the previous year.
(1) Represents yearly high and yearly low of ADSs
(1) Represents yearly high and yearly low of ADSs
Infosys share price versus the BSE Sensex
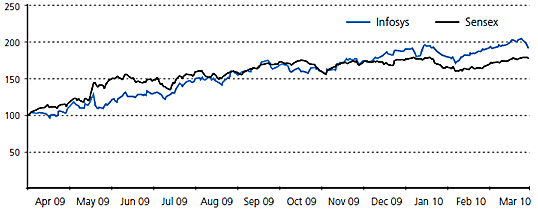
Base 100 = April 1, 2009
ADS premium compared to price quoted on BSE
Based on monthly high prices
Outstanding ADSs
Our ADSs as evidenced by American Depositary Receipts (ADRs) are traded in the U.S. on the NASDAQ Global Select Market under the ticker symbol ‘INFY’. Each equity share is represented by one ADS. The ADRs evidencing ADSs began trading on NASDAQ from March 11, 1999, when they were issued by the Depository Deutsche Bank Trust Company Americas (the Depository), pursuant to the Deposit Agreement. As at March 31, 2010, there were 35,565 record holders of ADRs evidencing 10,68,75,947 ADSs (1 ADS = 1 equity share).