Share transfers in physical form
Shares sent for physical transfer are effected after giving a 15-day notice to the seller for confirmation of the sale. Our share transfer committee meets as often as required. The total number of shares transferred in physical form during the year was 424 as against 60 for the previous year.
Listing on stock exchanges
Codes |
India |
Global |
|
NSE |
BSE |
NASDAQ |
|
Exchange |
INFOSYSTCH |
500209 |
INFY |
Reuters |
INFY.NS |
INFY.BO |
INFY.O |
Bloomberg |
NINFO IN |
INFO IN |
– |
The listing fees for fiscal 2012 have been paid for all the above stock exchanges.
Stock market data relating to shares listed in India
Our market capitalization is included in the computation of the BSE-30 Sensitive Index (Sensex), the BSE Dollex, S&P CNX NIFTY Index and NASDAQ-100 Index. The monthly high and low quotations, as well as the volume of shares traded at the BSE, the NSE and NASDAQ for the current year are provided in the following page.
Shareholding pattern
Category |
March 31, 2011 |
March 31, 2010 |
||||
Shareholders (no.) |
Voting strength (%) |
Number of shares held |
Shareholders (no.) |
Voting strength (%) |
Number of shares held |
|
Founders holding |
||||||
Indian founders |
19 |
16.04 |
9,20,85,078 |
19 |
16.05 |
9,20,84,978 |
Total founders holding (A) |
19 |
16.04 |
9,20,85,078 |
19 |
16.05 |
9,20,84,978 |
Public shareholding |
||||||
Institutional investors |
||||||
Mutual funds |
332 |
4.60 |
2,63,83,936 |
266 |
4.02 |
2,30,90,168 |
Banks, financial institutions and insurance companies |
60 |
4.40 |
2,52,50,097 |
55 |
3.90 |
2,24,10,708 |
Foreign institutional investors |
989 |
36.12 |
20,73,99,314 |
892 |
36.36 |
20,86,37,229 |
Others |
||||||
Private corporate bodies |
3,357 |
6.70 |
3,84,66,629 |
3,223 |
5.40 |
3,09,81,305 |
Indian public |
4,05,131 |
13.18 |
7,56,70,639 |
3,70,644 |
14.33 |
8,22,20,794 |
NRIs / OCBs / Foreign nationals |
6,696 |
0.86 |
49,37,208 |
6,571 |
0.81 |
46,58,086 |
Trusts |
38 |
0.50 |
29,08,637 |
45 |
0.50 |
28,65,977 |
Total public shareholding (B) |
4,16,603 |
66.36 |
38,10,16,460 |
3,81,696 |
65.32 |
37,48,64,267 |
Equity shares underlying ADS (C) |
1 |
17.60 |
10,10,50,021 |
1 |
18.63 |
10,68,75,947 |
Total (A + B + C) |
4,16,623 |
100.00 |
57,41,51,559 |
3,81,716 |
100.00 |
57,38,25,192 |
Stock market data – Exchanges in India
BSE |
NSE |
Total volume |
|||||
| High ( |
Low ( |
Volume (No.) |
High ( |
Low ( |
Volume (No.) |
(BSE & NSE) (No.) |
|
2010 |
|||||||
April |
2,801.55 |
2,644.05 |
38,02,005 |
2,801.60 |
2,643.75 |
2,62,06,242 |
3,00,08,247 |
May |
2,702.15 |
2,533.30 |
20,57,441 |
2,706.15 |
2,533.40 |
2,03,97,880 |
2,24,55,321 |
June |
2,817.90 |
2,625.25 |
18,12,206 |
2,822.70 |
2,624.35 |
1,80,94,283 |
1,99,06,489 |
July |
2,894.95 |
2,729.00 |
28,21,046 |
2,895.90 |
2,727.50 |
2,01,31,995 |
2,29,53,041 |
August |
2,873.40 |
2,696.00 |
15,50,015 |
2,874.65 |
2,700.45 |
1,49,29,717 |
1,64,79,732 |
September |
3,058.50 |
2,750.65 |
19,29,074 |
3,059.15 |
2,753.00 |
2,25,48,316 |
2,44,77,390 |
October |
3,184.25 |
2,969.60 |
29,26,489 |
3,185.25 |
2,970.85 |
2,47,46,483 |
2,76,72,972 |
November |
3,082.90 |
2,966.45 |
16,12,368 |
3,082.65 |
2,963.80 |
1,73,13,835 |
1,89,26,203 |
December |
3,445.00 |
3,054.55 |
19,67,499 |
3,446.95 |
3,052.40 |
1,74,02,190 |
1,93,69,689 |
2011 |
|||||||
January |
3,475.85 |
3,116.30 |
24,39,518 |
3,481.45 |
3,117.70 |
2,28,41,828 |
2,52,81,346 |
February |
3,161.20 |
3,003.05 |
16,89,953 |
3,165.25 |
2,997.10 |
2,02,18,080 |
2,19,08,033 |
March |
3,236.75 |
2,922.15 |
23,82,349 |
3,241.30 |
2,922.30 |
2,30,22,036 |
2,54,04,385 |
Total |
3,475.85 (1) |
2,533.30 (1) |
2,69,89,963 |
3,481.45 (1) |
2,533.40 (1) |
24,78,52,885 |
27,48,42,848 |
Volume traded / average outstanding shares (%) |
FY 2011 |
6 |
52 |
58 |
|||
FY 2010 |
9 |
72 |
81 |
||||
FY 2009 |
18 |
100 |
118 |
||||
| Note : | The number of shares outstanding is 47,31,01,538. American Depositary Shares (ADSs) have been excluded for the purpose of this calculation. |
| (1) Represents yearly high and yearly low of equity shares. |
Stock market data – NASDAQ
High ($) |
Low ($) |
High ( |
Low ( |
Volume (No.) |
|
2010 |
|||||
April |
63.05 |
59.86 |
2,796.90 |
2,655.40 |
3,49,68,168 |
May |
60.75 |
55.18 |
2,816.97 |
2,558.70 |
3,56,44,538 |
June |
63.56 |
56.55 |
2,952.36 |
2,626.75 |
2,99,59,933 |
July |
63.02 |
58.01 |
2,832.11 |
2,606.96 |
3,01,27,055 |
August |
63.37 |
57.28 |
2,487.84 |
2,574.16 |
2,39,45,776 |
September |
67.31 |
59.70 |
3,024.91 |
2,682.91 |
2,75,77,117 |
October |
71.20 |
66.34 |
3,154.16 |
2,947.48 |
3,57,49,334 |
November |
69.56 |
64.51 |
3,191.41 |
2,959.71 |
2,42,38,801 |
December |
76.41 |
67.85 |
3,416.29 |
3,033.57 |
1,86,54,990 |
2011 |
|||||
January |
77.53 |
67.62 |
3,559.40 |
3,104.43 |
3,54,93,366 |
February |
69.56 |
66.52 |
3,148.98 |
3,011.36 |
2,15,98,322 |
March |
71.70 |
64.52 |
3,197.82 |
2,877.59 |
3,33,67,452 |
Total |
77.53 (1) |
55.18 (1) |
3,559.40 (1) |
2,558.70 (1) |
35,13,24,852 |
| Notes : | 1 ADS = 1 equity share. U.S. dollar has been converted into Indian rupee at the monthly closing rates. The number of ADSs outstanding as at March 31, 2011 was 10,10,50,021. The percentage of volume traded to the total float was 347.67% as against 500.24% in the previous year. |
| (1) Represents yearly high and yearly low of ADSs |
Infosys share price versus the BSE Sensex
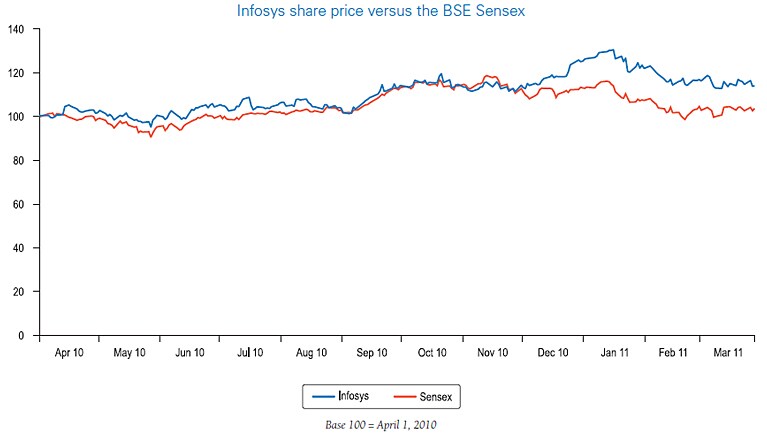
Base 100 = April 1, 2010
ADS premium compared to price quoted on BSE
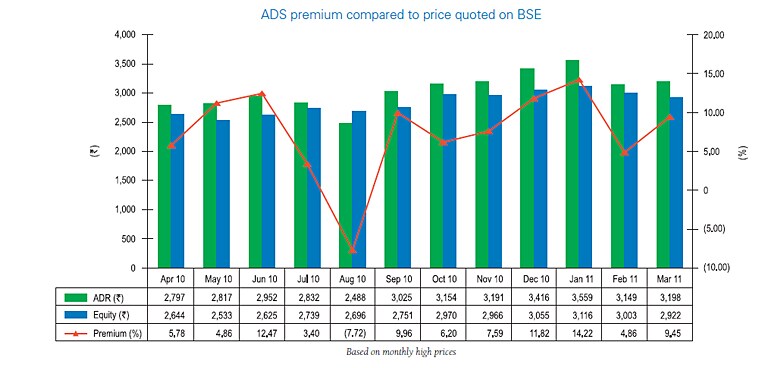
Based on monthly high prices
Outstanding ADSs
Our ADSs as evidenced by American Depositary Receipts (ADRs) are traded in the U.S. on the NASDAQ Global Select Market under the ticker symbol ‘INFY’. Each equity share is represented by one ADS. The ADRs evidencing ADSs began trading on NASDAQ from March 11, 1999, when they were issued by the Depository Deutsche Bank Trust Company Americas (the Depository), pursuant to the Deposit Agreement. As at March 31, 2011, there were 54,850 record holders of ADRs evidencing 10,10,50,021 ADSs (1 ADS = 1 equity share).
Share price chart
We caution that the stock price performance shown in the graph below should not be considered indicative of potential future stock price performance.
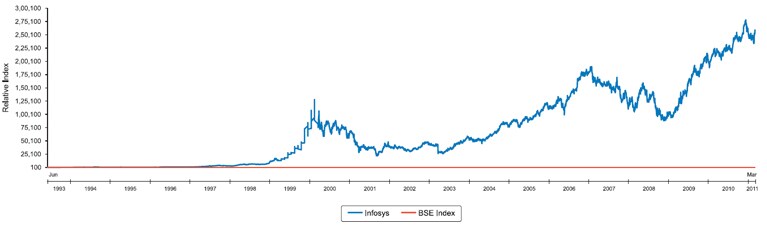
Notes : Adjusted for bonus issues and stock split.
Base 100 = June 1993.
Historical stock price performance should not be considered indicative of potential future stock price performance.