
Research & Applied Innovation

Enterprise datasets often include gaps, abbreviations, local process conventions, and fields whose meanings changed after migration or during a reporting cleanup. Accessing data is only the first step; analysis still requires review by people who understand the operating process.
The work often gets split into pieces. One team prepares the extract, another explores the numbers, a domain expert reviews anomalies, and a separate analyst develops the narrative. Figure 1 shows these handoffs across data preparation, cleanup, analysis, interpretation, and reporting slow the path from data to insight.
Figure 1. Traditional workflow for enterprise datasets

Each transition adds delay, context loss, and reinterpretation risk. Common friction points are: repeated clarification across teams, lost assumptions and caveats, rework after late expert review, slow movement from raw data to action, and metrics interpreted without field-quality context.
Source: Infosys
The challenge becomes even greater at scale. Engineering telemetry and text repositories cannot simply be queried; they require structured, iterative data science manipulation before yielding valuable strategic insights. Traditional generative AI can assist with individual tasks, but it cannot independently execute and coordinate the end-to-end analytical process.
This is where agentic workflows become valuable. By deploying networks of specialized agents that programmatically automate cleaning, model training, and analytical review, organizations scale expert-level data science capabilities instantly.
Infosys built a multiagent research system (MARS), available through Infosys Topaz Fabric [1], to support this approach. In one run, MARS inspects data, executes code, critiques intermediate results, and prepares a draft.
Human review remains essential for data definitions, method choices, and recommendations that impact operations.
Key distinction: A research agent still must inspect it, question it, and defend its conclusions. This is why MARS keeps profiling, analysis, critique, and drafting inside one connected run, directly automating a data science workflow that is otherwise highly laborious, deeply iterative, and error-prone for a human team.
MARS draws on recent work in autonomous scientific discovery. The Denario project [2] describes a modular multiagent system that generates ideas, checks literature, develops research plans, writes and executes code, creates plots, and drafts scientific papers. It uses cmbagent [3] as a deep-research backend for end-to-end scientific analysis.
The system uses a planning and control strategy with about 30 large language model (LLM) agents that retrieve context, generate code, interpret results, critique intermediate outputs, and execute code locally. The project demonstrated the approach to cosmology research and benchmark tasks.
It applies that pattern to enterprise data. Unlike scientific datasets, enterprise data introduces constraints such as access controls, incomplete labels, and ambiguous fields. A wrong conclusion may affect staffing, automation priorities, or service-level agreement (SLA) reporting. The output must show what the data revealed, why a method fits the question, which results survived critique, and which recommendations should reach a service owner.
The workflow, as shown in Figure 2, adapts scientific-discovery agents to enterprise data analysis. Specialized agents coordinate across data ingestion, exploratory data analysis (EDA), method selection, experiment execution, interpretation, review, and paper generation through a shared research state.
Figure 2. MARS workflow for enterprise datasets
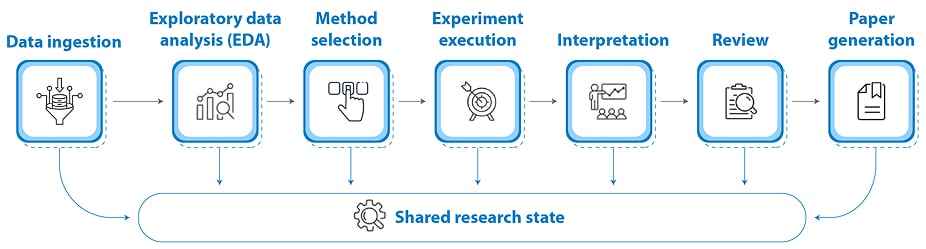
Human review points validate data use, method selection, interpretation, and operational recommendations. This workflow reduces repetitive analytical effort while keeping evidence, assumptions, and caveats connected in a single review-aware process.
Source: Infosys
MARS uses a staged research pipeline comprising four stages: idea generation, method development, experiment execution, and paper generation. Figure 3 shows MARS architecture, in which four stages (ideate, design, execute, and report) produce artifacts that users review before the workflow advances.
Figure 3. MARS architecture: Staged research pipeline with review gates
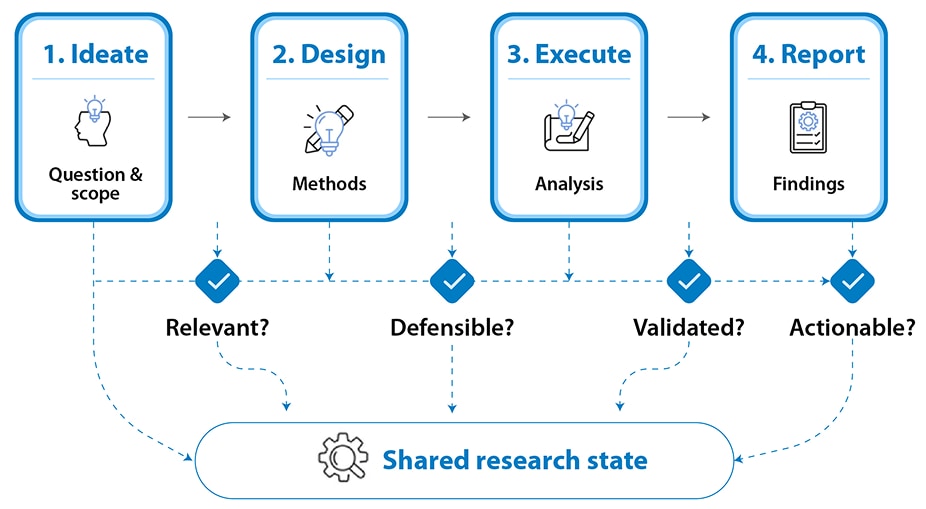
The workflow progresses through four stages with review checkpoints between stages. A shared research state maintains continuity across analyses, enabling reproducibility, governance, and human oversight while preserving evidence and decisions throughout the workflow.
Source: Infosys
Staging matters because enterprise data often faces constraints on quality, access, and interpretation. Missing values, inconsistent labels, sensitive fields, and operational shorthand can all affect the outcome. An agent that jumps from upload to conclusion may produce unsupported results. The system places review points around data-quality checks, method justification, and assumption review.
For an enterprise research workflow, the relevant architecture question is whether the system preserves state across data profiling, method selection, code execution, critique, and report generation. Users need clear progress visibility, repeatable runs, credential control, and continuity across long analyses to feel confident in the system's reliability and control.
The IT operations (ITOps) analysis used a large historical service desk extract. The records covered incidents and requests across systems, SLAs, priorities, ownership groups, categories, and resolution notes.
MARS first prepared the extract for analysis. It consolidated raw files, removed duplicate ticket identifiers, checked timestamp logic, standardized date fields, engineered fulfillment-duration features, and retained missing categorical values under an "Unknown" label. The workflow then moved into EDA, model selection, code execution, error handling, and revised analysis.
The system selected the analysis path autonomously, without a human specifying which methods to apply. After profiling the ticket fields and text descriptions, it chose a natural language processing (NLP) workflow. It applied latent Dirichlet allocation (LDA) [4], an unsupervised topic modeling method, to the ticket descriptions. Fulfillment-duration analysis used mean time to fulfill (MTTF), percentile metrics, and anomaly detection to distinguish normal service behavior from outliers.
The system also examined temporal patterns across daily, weekly, and seasonal windows, then tested correlations between ticket characteristics and resolution time. Predictive models estimated fulfillment time and recommended assignment groups. In a controlled experimental run on the IT support ticket dataset [5], the system achieved 88.5% accuracy in assignment-group recommendation and a mean absolute error of 10.5 hours in fulfillment-time prediction. These are feasibility results from a research run, not production benchmarks. They support routing decisions, workload planning, and targeted process improvement.
The system autonomously generated analysis code, executed it, detected errors, revised the code, and continued the analysis. Enterprise datasets often expose schema issues, missing fields, and data-quality exceptions only after code runs.
Figure 4 presents the ticket-analysis pipeline, showing the progression of raw tickets through ingest, assess, explore, SLA, model, interpret, and report stages, with quality constraints informing the analysis workflow.
Figure 4. MARS pipeline for ITOps ticket analysis
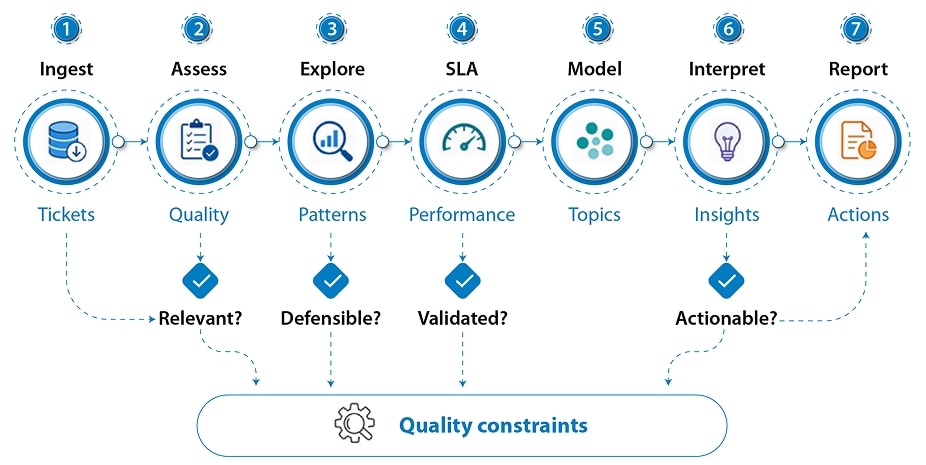
The ticket-analysis pipeline connects data ingestion, quality assessment, exploratory analysis, SLA evaluation, topic modeling, and operational interpretation within a single workflow, enabling quality-aware insights and evidence-based operational recommendations.
Source: Infosys
MARS began with data-quality checks before calculating metrics or building models. Ticket datasets mix structured fields, free-text notes, system-generated updates, inconsistent category names, and partial timestamps. Invalid timestamps and missing priority values directly affect resolution-time analysis, SLA calculations, and topic discovery.
This execution found that priority and incident-state fields were missing across most records. The closed-at timestamp was also absent in many cases. Those gaps limited SLA interpretation and made some resolution-time calculations unusable.
The priority field had the most severe completeness issue. The "Unknown" priority group dominated the dataset, while low-priority tickets accounted for a much smaller share. Priority-based charts, therefore, needed a clear caveat about missing urgency labels.
Timestamp inconsistencies also appeared, including records where resolution appeared to precede creation. MARS excluded those records from time-based distribution analysis.
This execution attached each quality constraint, such as missing priority and incident-state fields, absent closure timestamps, and invalid time sequences, to the metrics it affected. This reflects a general principle for enterprise research agents: quality constraints should be reported alongside the claims they qualify, because completeness, consistency, uniqueness, validity, and timeliness [6] all shape how metrics should be interpreted.
Why it matters: A metric is only as trustworthy as the field it's built on. When priority, closure timestamps, or category labels are missing, that gap must travel with the number it affects — not sitting in a footnote the reader may never reach.
SLA analysis measured whether tickets were resolved within expected time windows, where breaches concentrated, and which ticket attributes correlated with delay. The first technical step was to define the calculation rules: start time, pause conditions, closure time, priority thresholds, reopened-ticket treatment, and invalid-record exclusions.
The resolution-time distribution was skewed. Many tickets closed quickly, but a smaller group stayed open long enough to distort reported performance. A single average would have hidden that long tail.
Priority segmentation needed caution. Tickets with unknown priority often moved differently from tickets explicitly marked as low priority. This pattern should be reviewed with service owners before attributing it to routing behavior or work prioritization.
Workload was concentrated in a few support groups. A small set of assignment groups accounted for a large share of ticket volume, with the access management queue being high-volume. A practical improvement test would target the highest-volume queues and then measure whether backlog and long-tail delays changed.
The ticket history included a large outflow spike. A bulk update, migration, or mass closure was more plausible than a sudden increase in operational capacity. Outside that anomaly, monthly ticket inflow stayed relatively steady while outflow generally lagged inflow.
Reported percentiles and breach rates depend on the calculation rules above. Segment-level figures should be read considering the missing-priority and invalid-timestamp caveats, which limit precision for affected records.
Ticket descriptions contain abbreviations, product names, error messages, manual updates, and copied logs. Topic modeling identifies recurring problem themes when category labels are too broad or inconsistent.
MARS applied LDA to the ticket descriptions. The text pipeline converted descriptions to lowercase, removed common stop words, tokenized text, and lemmatized words before building the document-term matrix.
The model found several interpretable topics. The largest themes included shared drive and software access, general user login and email issues, and account support. Together, those themes represented a substantial share of total volume.
These topics suggested different improvement options. Access requests, login issues, and account support are repeatable service patterns. Depending on the service-owner review, they may point to self-service flows, workflow automation, knowledge base cleanup, or clearer ownership rules.
The topic mix stayed stable across the nine-month window. Persistent service demand, not one-time incidents, drove the pattern. Stable, high-volume topics are better candidates for automation than short-lived spikes. Figure 5 illustrates how ticket text moves through clean, represent, cluster, label, prioritize, and act stages, with service owner review validating topics before operational actions are taken.
Figure 5. Topic modeling pattern for problem management
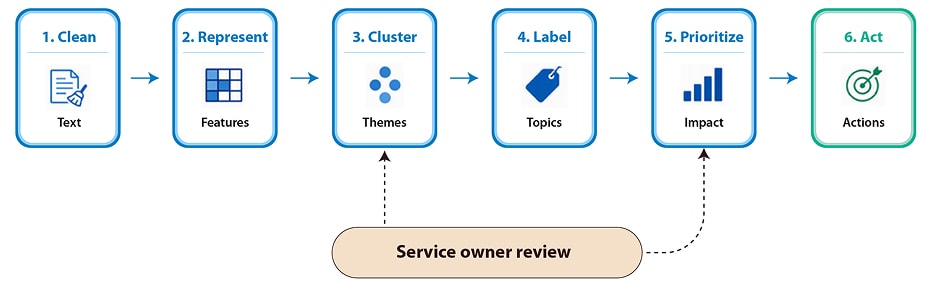
Topic modeling connects recurring text themes to operational hypotheses. Topic labels require review by service owners before they become problem-management actions.
Source: Infosys
MARS combined key performance indicator analysis with topic modeling. Key performance indicator analysis exposed workload concentration and long-tail delays. Topic modeling showed that routine-request themes accounted for a large share of demand.
The workflow kept analysis steps connected. Data profiling informed feature engineering, feature engineering shaped metric cuts, and anomaly review changed how charts were interpreted. Topic discovery then gave service owners a text-based view of recurring demand.
The recommendations differed by pattern. High-volume, routine topics were candidates for self-service, workflow automation, and knowledge base improvement. Long-tail delays required queue-aging controls, escalation rules, ownership reviews, and root-cause analysis for complex ticket families.
Missing fields, inconsistent timestamps, and ambiguous category labels limited precision. Human reviewers still need to validate metric definitions, anomaly explanations, topic labels, and final recommendations.
Scientific-discovery agents plan, execute, critique, and draft complex analyses. Enterprise use adds data sensitivity, operational impact, and weak labels. Human review is still needed when the data is sensitive, the recommendation affects operations, or the model is working from incomplete labels.
MARS uses human review at each stage. In enterprise analytics, that review should focus on decisions that affect interpretation or action. A service owner may recognize that two topics describe the same outage pattern. A data steward may know that a field changed meaning after a platform migration. Those details require domain knowledge.
Review time should go to decisions with consequences, including data-use approval, quality interpretation, method selection, metric definitions, topic labels, and final recommendations. Agents handle broad exploration, code execution, method comparison, and first-draft reporting.
Quality principle: Agents scale exploration. Human reviewers protect judgment. MARS value depends on routing review time to decisions with consequences — data-use approval, metric definitions, topic labels — while agents handle the broad first pass.
Enterprise research agents need governance for confidential records, credentials, code execution, audit trails, and generated artifacts. MARS includes encrypted credential storage and multiprovider configuration. An enterprise deployment requires identity management, access control, data classification, policy enforcement, logging, and artifact lineage.
Code execution creates specific governance requirements. Code-executing agent workflows, such as cmbagent [3], run local code during analysis. This yields stronger results than prose-only summaries because the agents compute statistics and generate plots directly. It also creates risk. Sensitive datasets require sandboxing, package controls, output scanning, resource limits, and approval paths.
A practical governance model records the dataset version, prompts, agent decisions, code, execution outputs, figures, review comments, and final report. That lineage supports reproducibility and later review when assumptions change.
The ITOps run points to patterns that transfer to other datasets: claims, procurement records, call-center transcripts, incident logs, and asset maintenance records. They all mix structured fields with messy text. In each case, premature model selection creates analysis risk.
Data-quality findings should be reported with the affected results. If priority, closure time, or category labels are missing, the analysis report should say so near the affected claim. The method choice should come later. In this case, weak categories made topic modeling reasonable.
Topic interpretation needs an operational context. Useful context includes volume, recurrence, cost, SLA impact, ownership, and automation potential. Bulk updates and migrations should be separated from real operating trends. Automation candidates become clearer when topic volume, team concentration, and resolution time all point in the same direction.
Agentic research systems do not replace domain expertise. Their value comes from keeping the question, code, charts, caveats, and final write-up in sync.
Enterprise AI pattern: Data-quality transparency + staged review + domain-grounded interpretation = decisions teams can act on.
The next phase for MARS is evaluation. Research-agent outputs need benchmarks for data-quality detection, code correctness, reproducibility, method choice, topic stability, reviewer intervention, and the operational value of recommendations.
For ITOps, the near-term comparison should be concrete: LDA topic models, transformer-based topic representations [7], and LLM-assisted topic labeling across multiple ticket datasets. The evaluation should test topic coherence, stability across time windows, and usefulness for service owners.
Future evaluations should also test operational integration. If a topic identifies a recurring issue, MARS should support downstream work, such as problem record creation, knowledge base article drafting, automation candidate ranking, and preventive action tracking. The evaluation should measure whether findings change how teams manage tickets.

